
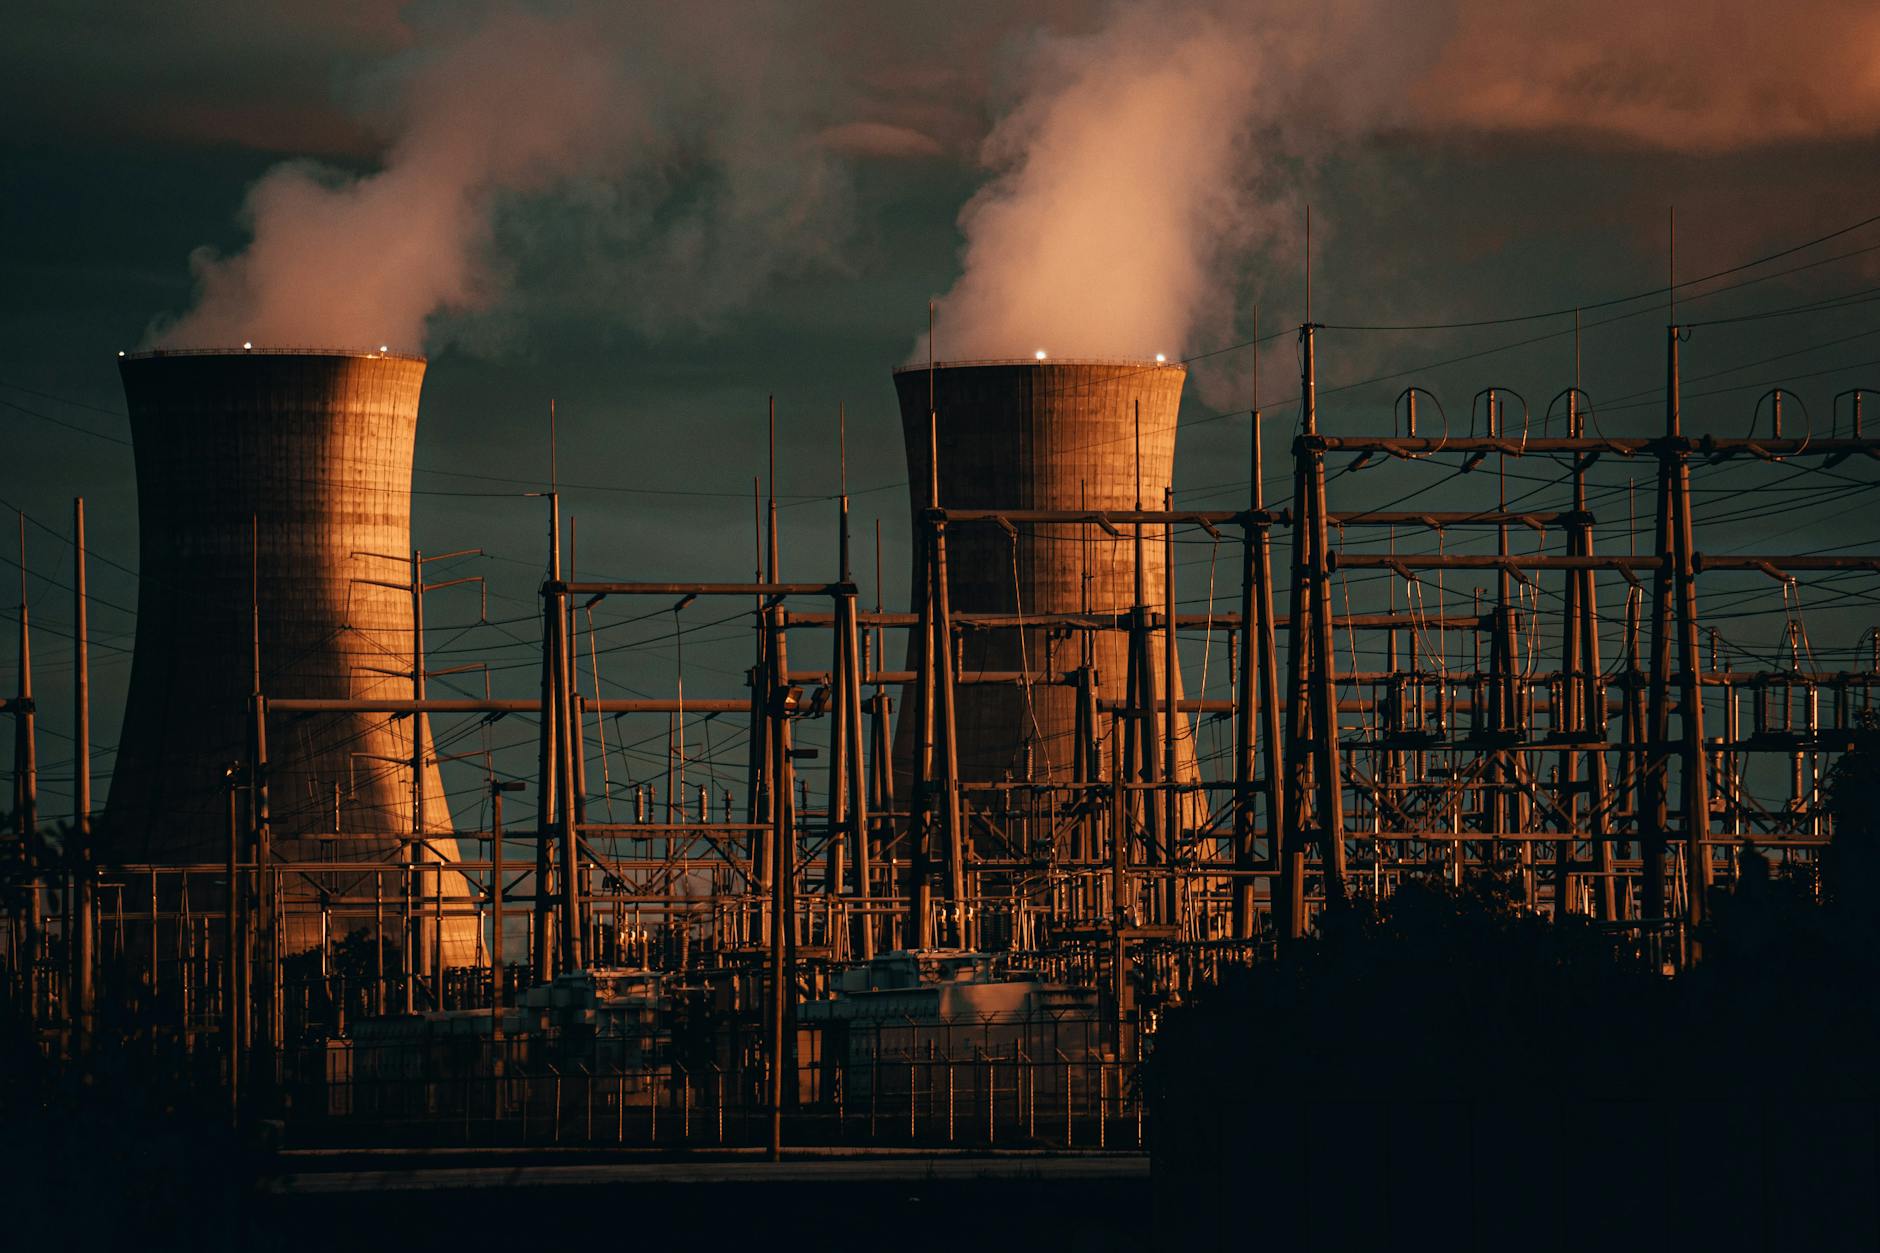
Introduction: The Plant-as-Option Framework
Here’s a mind-bending idea: A power plant is not just a piece of machinery. It’s a financial call option with a strike price equal to its variable cost.
Every hour, the plant “owner” (or operator) can choose:
- Exercise the option: Run the plant, sell power at market price
- Let it expire: Keep it offline if market price < variable cost
This optionality has value—even if the plant loses money on average. Understanding this concept is fundamental to generation asset management and energy trading strategy.
Spark Spreads Explained: The Basic Profitability Metric
The spark spread is the fundamental profitability measure for thermal power plants:
Spark Spread = Electricity Price – Fuel Cost
Example: Gas-Fired Plant
- Electricity price: €80/MWh
- Natural gas price: €30/MWh (thermal)
- Plant efficiency: 50% (needs 2 MWh gas to produce 1 MWh electricity)
- Fuel cost: €30 × 2 = €60/MWh
- Spark spread: €80 – €60 = €20/MWh
If spark spread > 0: Run the plant (make money)
If spark spread < 0: Keep it offline (lose money if you run it)
For Coal Plants:
- Spark spread still used (technically “dark spread” but often called spark spread)
- Coal price + variable O&M costs determine fuel cost
For Nuclear:
- Extremely low fuel cost (~€5/MWh)
- Always profitable to run (baseload plants)
Clean Spark Spreads: Adding CO₂ Costs
In Europe, power plants must buy CO₂ allowances for every ton emitted. This creates the clean spark spread:
Clean Spark Spread = Electricity Price – Fuel Cost – CO₂ Cost
Example: Gas Plant in 2025
- Electricity price: €85/MWh
- Gas price: €35/MWh (thermal)
- Efficiency: 50% (2 MWh gas per 1 MWh electricity)
- CO₂ emissions: 0.4 tons CO₂ per MWh electricity
- CO₂ allowance price: €80/ton
Calculation:
- Fuel cost: €35 × 2 = €70/MWh
- CO₂ cost: 0.4 tons × €80 = €32/MWh
- Total variable cost: €70 + €32 = €102/MWh
- Clean spark spread: €85 – €102 = -€17/MWh (LOSS)
Decision: Keep plant offline this hour.
Why This Matters:
- CO₂ prices went from €5/ton (2017) to €100+/ton (2023)
- This destroyed the economics of coal plants
- Shifted merit order: Gas plants overtook coal as cheaper marginal plants
- Accelerated coal phase-outs across Europe
Real Example: German Gas Plants Lost Money for 12 Years (2008-2020)
This is one of the most striking realities of European power markets:
The Setup:
- Germany built significant gas capacity in 2000s
- Expected gas plants to be mid-merit (running regularly)
- What actually happened: Renewables + cheap coal pushed gas far back in merit order
The Numbers (Simplified Average 2008-2020):
Operating Costs (Gas Plant):
- Gas fuel: €40/MWh equivalent
- Variable O&M: €3/MWh
- CO₂ cost: €15/MWh (average over period)
- Total variable cost: €58/MWh
Market Prices:
- Average baseload price: €45/MWh
- Average peak price: €60/MWh
Spark Spread:
- Baseload: €45 – €58 = -€13/MWh (loss)
- Peak: €60 – €58 = +€2/MWh (tiny profit)
Annual Plant Performance:
- Capacity: 500 MW
- Potential output: 500 MW × 8,760 hours = 4,380 GWh/year
- Actual output: ~800 GWh/year (18% utilization—ran only during very high prices)
- Fixed costs: ~€40M/year (capital, staffing, maintenance)
- Revenue: €48M (800 GWh × €60 average when running)
- Variable costs: €46.4M (800 GWh × €58)
- Contribution margin: €1.6M
- Net result: €1.6M – €40M fixed costs = -€38.4M annual loss
Why Didn’t They Shut Down?
- Optionality value: Kept plant ready for price spikes
- Capacity payments: Some markets paid to keep capacity available
- Regulatory requirements: Required for grid stability
- Hope: Waiting for coal plants to retire (eventually happened)
What Changed After 2020:
- Coal retirements accelerated
- Russian gas supply disruptions (2022)
- Gas plants became profitable again (moved up merit order)
Lesson: Average economics don’t matter—optionality does. The plant’s value wasn’t average profitability but the option to produce during scarcity.
Power Plants as Call Options: The Deep Insight
Let’s formalize why a power plant is like a call option:
Financial Call Option:
- Right (not obligation) to buy asset at strike price
- Exercise if market price > strike price
- Value depends on: probability of market price > strike, volatility
Power Plant:
- Right (not obligation) to produce at variable cost
- Exercise (run) if electricity price > variable cost
- Value depends on: probability of price > variable cost, price volatility
Mathematical Parallel:
Call Option Value:
V = P(S > K) × E[S - K | S > K]
Where:
- S = market price
- K = strike price
- P(S > K) = probability market exceeds strike
Power Plant Value:
V = P(Price > VC) × E[Price - VC | Price > VC] × Capacity
Where:
- Price = electricity market price
- VC = variable cost (fuel + CO₂ + O&M)
- Capacity = MW rating
Key Insight: Even if price > VC only 10% of the time, the plant has value because:
- Those 10% hours could have very high spreads
- You have no downside (don’t run when unprofitable)
- This asymmetric payoff is classic option value
Optionality = Value: Why Flexibility Matters
Example: Comparing Two Assets
Asset A: Wind Farm
- Capacity: 100 MW
- Capacity factor: 25% (runs 2,190 hours/year at full power)
- Variable cost: €0/MWh (no fuel)
- Must produce when wind blows (no choice)
- Revenue: 2,190 hours × 100 MW × average price = €219M (if avg price = €100)
Asset B: Gas Peaker Plant
- Capacity: 100 MW
- Can run up to 8,760 hours/year
- Variable cost: €100/MWh
- Chooses when to run (flexibility)
- Revenue: Runs only when price > €100, sells at avg €150 during those hours
- Runs 500 hours/year × 100 MW × €150 = €7.5M revenue
- Variable costs: 500 hours × 100 MW × €100 = €5M
- Contribution: €2.5M
Which is more valuable?
- Wind farm: Higher output, higher revenue
- Gas plant: Lower output, but controls when
The Optionality Premium:
- Wind farm is long-only (can’t choose not to produce)
- Gas plant can time production to high-price hours
- In volatile markets, this timing ability has significant value
Real Market Evidence:
- Peaker plants earn “missing money” from scarcity pricing
- A plant running 50 hours/year (0.5% utilization) can still be economically viable
- Why? Those 50 hours might average €500/MWh vs. €100 variable cost
Make-or-Buy Decisions With Hedging
Generation assets create a natural question: Should we sell the physical output or hedge financially?
Scenario: Combined-Cycle Gas Turbine (CCGT)
- Capacity: 400 MW
- Expected output: 3,000 GWh/year (85% availability × 8,760 hours × 40% utilization)
- Variable cost: €65/MWh
- Forward price Year+1: €90/MWh
Option 1: Sell Physical Output (Day-Ahead Market)
- Produce when spark spread > 0
- Sell each hour at day-ahead price
- Retain optionality (don’t run if unprofitable)
- Revenue: Variable (depends on hourly prices)
- Risk: Price volatility, volume uncertainty
Option 2: Full Hedge (Sell Forwards)
- Sell 3,000 GWh Year+1 forwards at €90/MWh
- Lock in revenue: 3,000 GWh × €90 = €270M
- Problem: Lost optionality (must deliver even if spark spread negative)
- Result: Revenue certain, but forced to run at losses some hours
Option 3: Partial Hedge (Structured)
- Sell 2,000 GWh forwards at €90/MWh (baseload portion)
- Keep 1,000 GWh unhedged (peak/option hours)
- Benefits: Revenue certainty on base + optionality on flexible portion
- Tradeoff: Some price risk remains
Decision Framework:
- Risk tolerance: High → keep unhedged, low → full hedge
- Price view: Bullish → hedge less, bearish → hedge more
- Credit needs: Lenders prefer hedged revenue (bankability)
- Operational flexibility: Physical constraints limit optionality
Real Example: Wind Farm Hedging
- Wind farm produces 500 GWh/year (variable by weather)
- Forward market: €85/MWh
- Problem: Can’t guarantee exact volume (wind dependent)
- Solution: Sell baseload volume (400 GWh) in forwards, leave 100 GWh upside unhedged
- Result: Hedged revenue on 80%, retain 20% merchant exposure
Multi-Market Optimization: Beyond Day-Ahead
Sophisticated generation operators don’t just sell into day-ahead markets. They optimize across multiple revenue streams:
Revenue Stack for Flexible Gas Plant:
1. Day-Ahead Energy Market
- Sell electricity production at spot prices
- Typical: 50-70% of revenue
2. Intraday Energy Market
- Adjust positions closer to delivery
- Capture price spikes from forecast errors
- Typical: 5-10% of revenue
3. Frequency Containment Reserve (FCR)
- Keep plant ready to increase/decrease output instantly (±X MW)
- Paid capacity fee just for being available
- Typical: 10-15% of revenue
4. Automatic Frequency Restoration Reserve (aFRR)
- Automatically adjust output based on TSO signals
- Paid capacity + energy when activated
- Typical: 10-20% of revenue
5. Manual Frequency Restoration Reserve (mFRR)
- Manually adjust output when TSO calls
- Paid capacity + energy when dispatched
- Typical: 5-10% of revenue
Example Annual Revenue:
- Day-ahead energy: €7M
- Intraday: €800k
- FCR: €1.5M
- aFRR: €2M
- mFRR: €600k
- Total: €11.9M
vs. Day-Ahead Only: €7M
Lift from optimization: 70% revenue increase
The Complexity:
- Must bid into 5 different markets simultaneously
- Constraints: Can’t commit same capacity to multiple markets
- Optimization: Allocate capacity to highest-value market each hour
- Software required: Manual optimization impossible
Why Complexity = Opportunity
The German gas plant example (2008-2020 losses) reveals a deeper truth:
Simple Strategy: Run plant whenever spark spread > 0 → Lost money
Complex Strategy: Optimize across energy + reserves + forward hedging → Survived
Value Creation Areas:
- Market selection: Sell into balancing markets during scarcity (higher prices)
- Forward hedging: Lock in favorable prices during market contangos
- Option retention: Keep flexibility for extreme price events
- Startup optimization: Minimize expensive starts/stops
- Fuel procurement: Hedge gas prices separately from electricity sales
The Winners:
- Operators with sophisticated optimization software
- Traders embedded in asset operations
- Integration of fundamental analysis + algorithmic bidding
The Losers:
- “Set and forget” operators
- Pure merchant plants without hedging strategies
- Plants treating day-ahead as only market
Key Takeaways
✓ Spark spread = electricity price – fuel cost (clean spark adds CO₂)
✓ German gas plants lost money 2008-2020 due to renewables and cheap coal
✓ Power plants are call options: Value comes from optionality, not average economics
✓ Flexibility has value: Ability to choose when to run beats forced production
✓ Make-or-buy hedging: Balance revenue certainty vs. optionality retention
✓ Multi-market optimization: Energy + reserves stacking can increase revenue 70%
✓ Complexity = opportunity: Sophisticated operators capture value simple strategies miss
Next in Series: Post 7: Balancing Markets & Optimization: Where the Real Money Hides




Leave a Reply